Observability
Observability & diagnostics
QuestDB provides real-time metrics, a health check endpoint, and logging to monitor performance and simplify troubleshooting.
-
Metrics: QuestDB exposes detailed metrics in Prometheus format, including query statistics, memory usage, and I/O details.
-
Health check: A minimal HTTP server monitors system health.
-
Metadata tables: The engine provides metadata tables to query table status, partition status, query execution, and latency.
-
Extensive logging: Logging covers SQL parsing, execution, background processing, and runtime exceptions. The framework minimizes performance impact.
-
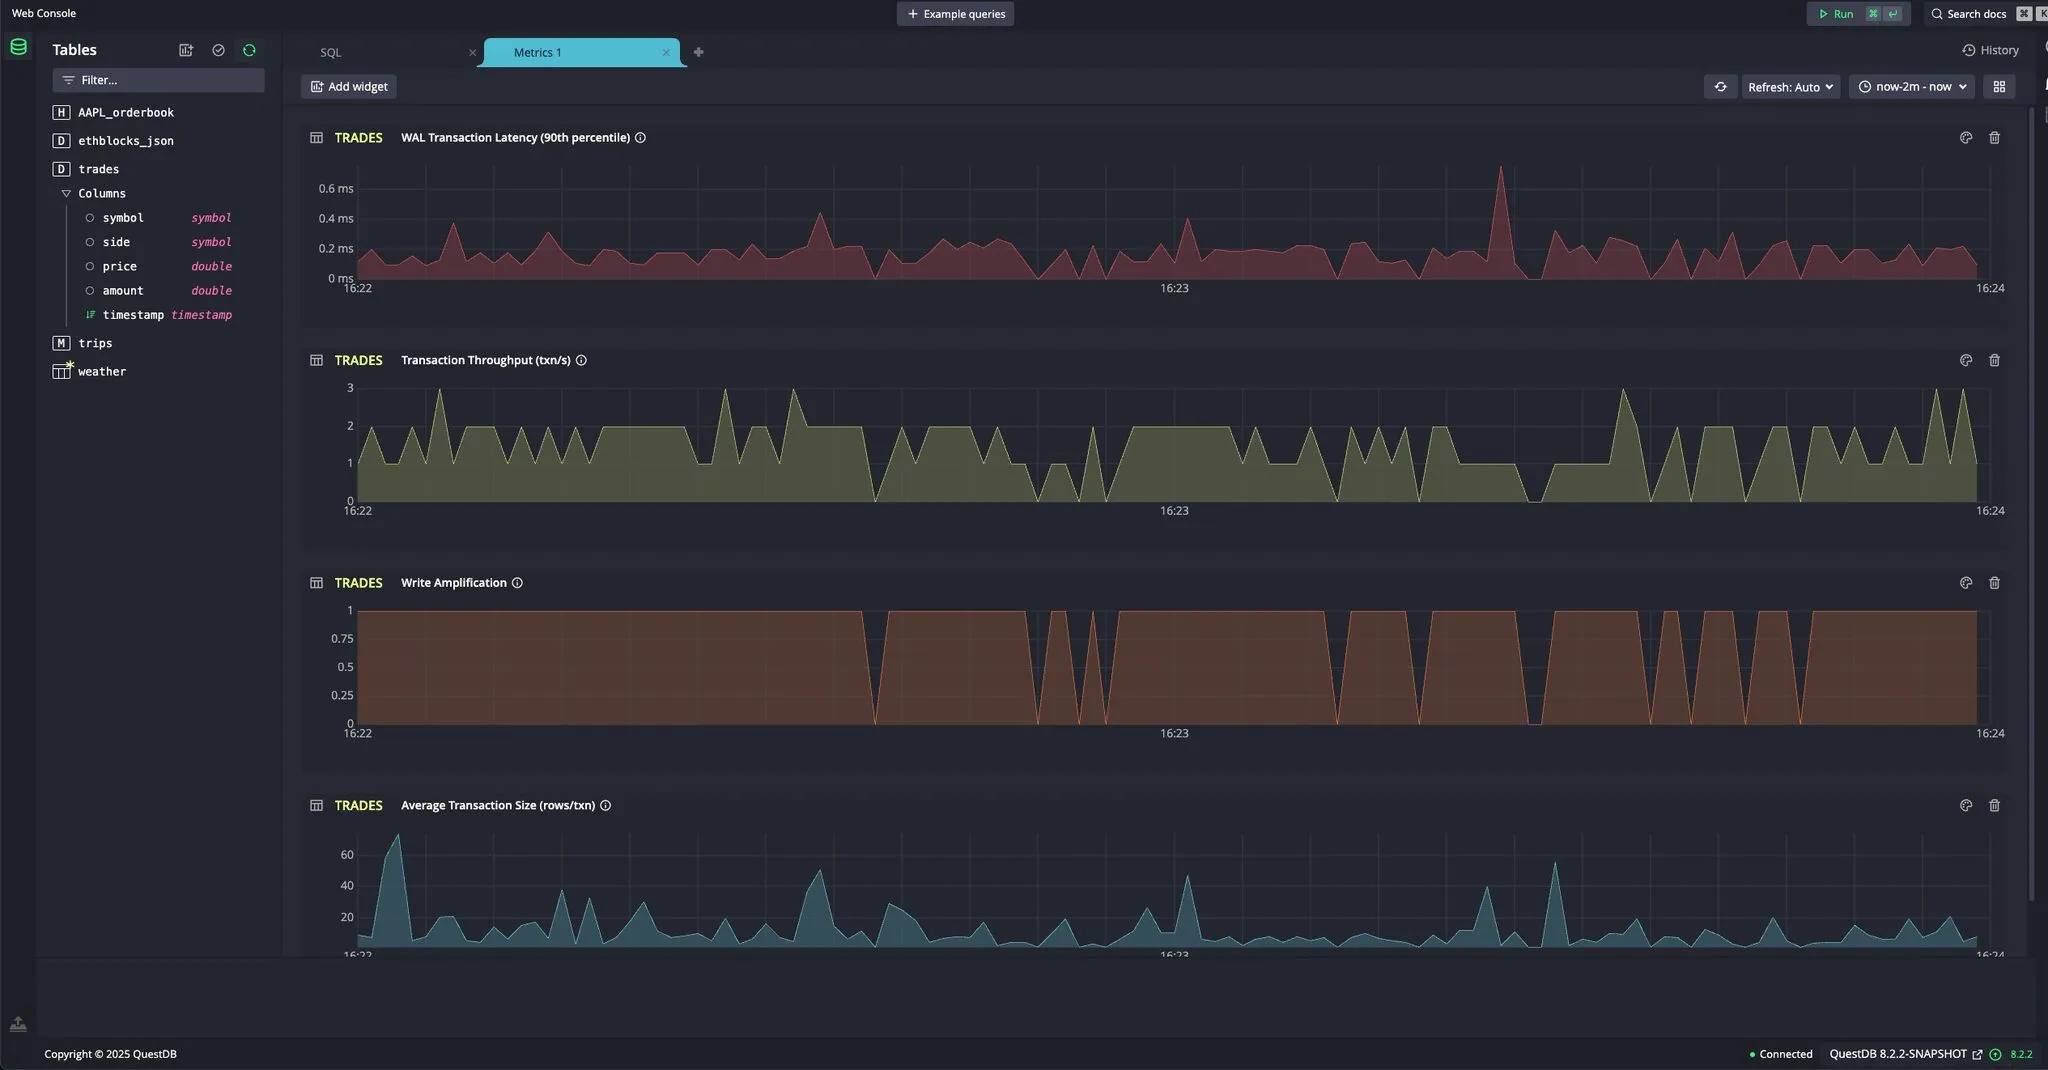
Real-time metric dashboards: The web console lets you create dashboards that display per-table metrics.
Next Steps
- Back to the QuestDB Architecture overview
- QuestDB GitHub Repository
- QuestDB Documentation